Releem: Monitor and analyze MySQL queries


Slow queries are not always the biggest source of database load. Frequently executed queries can consume more total time than rare slow ones. For example, a query that takes 30 ms but runs 10,000 times per minute creates more load than a 5-second query that runs once per hour.
Query analysis helps prioritize optimization work based on real impact rather than execution time alone.
Query analysis helps prioritize optimization work based on real impact rather than execution time alone.
How MySQL query analysis works
Releem monitors MySQL query execution using data from the Performance Schema during normal database operation. Query statistics are collected continuously without requiring application changes.
Similar queries are grouped together to reduce noise caused by different parameter values. Each group is analyzed based on execution time and how often it runs, making it possible to see which queries consume the most database time overall.
This approach helps surface both slow queries and frequently executed queries that have a high cumulative impact on performance.
Metrics you see
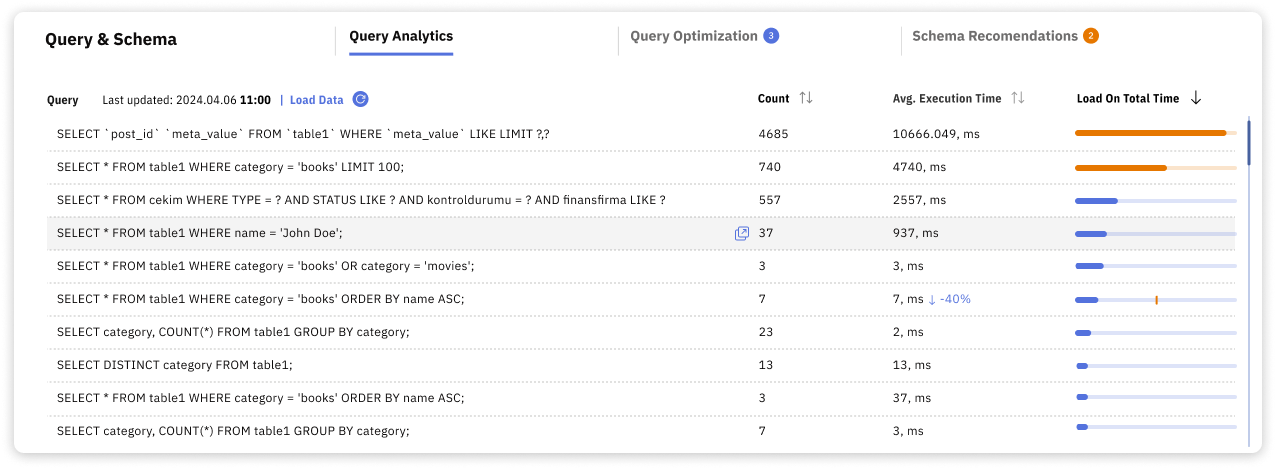
Query Analytics focuses on a small set of metrics that make it easier to understand query behavior and impact.
Load on total time is often the most useful metric, as it highlights queries that place the most pressure on the database overall, even if they are not individually slow.
- Execution count shows how often a query runs during the selected period.
- Average execution time shows how long a single execution takes.
- Load on total time shows the total time spent executing the query, combining execution time and frequency.
Load on total time is often the most useful metric, as it highlights queries that place the most pressure on the database overall, even if they are not individually slow.

How to show slow MySQL queries
Slow MySQL queries are identified by sorting queries by average execution time. This makes it easy to see which queries take the longest to run, even if they are executed infrequently.

Dashboard Query Analytics
How to show queries with highest performance impact
Queries with the highest performance impact are identified using Load on Total Time. This metric combines execution time and execution frequency to show which queries consume the most database time overall.
Click the Load on Total Time column heading to sort queries by total resource consumption rather than individual execution speed.
Click the Load on Total Time column heading to sort queries by total resource consumption rather than individual execution speed.

How to optimize SQL queries after analysis
Query analysis helps prioritize which queries should be optimized first.
Click any query to view the full SQL statement, EXPLAIN plan, and schema details.
Click any query to view the full SQL statement, EXPLAIN plan, and schema details.

Once high-impact queries are identified, optimization typically involves adding missing indexes, rewriting inefficient queries, or reducing execution frequency.
Click 'Get Recommendations' to receive specific suggestions for missing indexes and query rewrites.
Click 'Get Recommendations' to receive specific suggestions for missing indexes and query rewrites.

Releem is more than a MySQL query analytics tool
Releem also includes tools for monitoring, configuration analysis, schema review, and index recommendations.
Releem supports MySQL 5.7, 8.0, 8.1, and 8.4 on self-hosted servers, AWS RDS and Google Cloud SQL.
- MySQL monitoring continuously tracks key database metrics such as connections, buffer pool usage, and replication lag.
- Configuration tuning provides MySQL configuration recommendations based on workload patterns and available resources.
- Index suggestions identify missing indexes that could improve query execution time.
- Schema Optimization analyzes table structures and suggests changes that reduce storage usage and improve query performance.
Releem supports MySQL 5.7, 8.0, 8.1, and 8.4 on self-hosted servers, AWS RDS and Google Cloud SQL.
Get your own database advisor
Try Releem premium today for FREE!
Try Releem premium today for FREE!